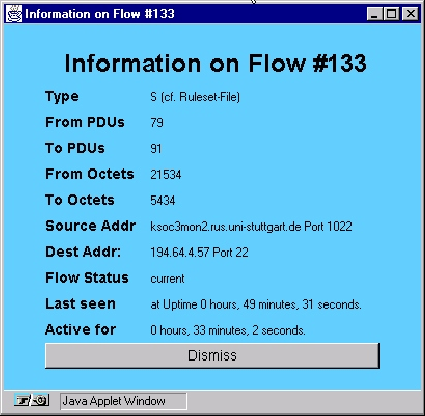
The title line of this window is used to display the flow number, which together with the time when the flow was first seen can be used as a unique flow identifier. Below, the flow kind, as specified in the ruleset file, can be determined. In our example, the letter ``S'' is used for all ``ssh'' (secure shell) flows, i.e. flows that use the TCP port number 22.
The ``From PDUs'' and ``To PDUs'' lines are self-explaining. They give information about the number of PDUs transferred in each direction. In the same way the two following lines inform about the number of octets that were transferred. By dividing the number of octets by the number of PDUs one can easily see the average size of a PDU in each direction of the flow.
The two following lines show the source and destination
IP![]() address. From the destination address
field in the example one can indeed see that the flow depicted here
was a secure shell (ssh) flow, since the port number used on the
destination machine was the secure shell port (22). Only the source
address is displayed in non-numeric form because of a bug in the
current Java environment. This bug restricts the access to the name
server - the socket connection that would be needed in order to look
up the host name of the destination machine is refused by the security
manager.
address. From the destination address
field in the example one can indeed see that the flow depicted here
was a secure shell (ssh) flow, since the port number used on the
destination machine was the secure shell port (22). Only the source
address is displayed in non-numeric form because of a bug in the
current Java environment. This bug restricts the access to the name
server - the socket connection that would be needed in order to look
up the host name of the destination machine is refused by the security
manager.
The ``Flow Status'' field is also self-explaining. It can either contain the value ``current'' for flows for which data has been seen during the last measurement inteveral of the meter, or ``inactive'' when no data has been seen.
The last two lines are used to display exact time information for the flow. By calculating the difference between the two time values, one can determine the time when the flow was first seen.
Whenever the meter is queried and new information for a flow for which an information window is still open is received, this window is updated. This allows the user to permanently monitor the counts for one particular flow. As an example, the network manager could use this feature to select the traffic flow for a given application he suspects to misbehave. He would then just leave the flow information window open and could verify how much data this application is generating in both directions.